오늘은 ROC커브 그리기에 대해서 정리하려고 합니다.
1. Def로 정의해서 커브를 그리기2. 여러개의 커브를 같은 화면에 그리기
위의 두 방향으로 오늘 진행해보려 합니다.
우선 ROC커브에 대해서 간단히 설명해볼게요.
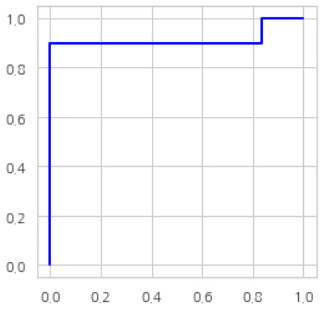
우선 Binary classification 경우, True를 모두 True로 맞춘 경우!
ROC커브의 면적값은 1이 됩니다.
이 말이 무엇이냐...역시 그림을 보면 이해가 쉬울텐데!
아래 그림과 같이 분류모델링의 성능이 좋으면 점점 왼쪽 모서리로 그래프가 올라가는 것입니다.

이제 코드작성으로 들어가볼까요?
1. 함수로 정의해서 코드 짜기
|
1
2
3
4
|
def roc_curve_fnc(p):
F_positive_rate, T_positive_rate, thresholds =roc_curve(p, test_y)
roc_auc = auc(F_positive_rate, T_positive_rate)
plt.step(F_positive_rate, T_positive_rate, color='blue', lw=2)
|
cs |
** lw는 line width를 뜻합니다.
위에처럼 코드를 짜 놓으면,
여러개의 모델을 돌렸을 때 편하게 사용할 수 있지요.
예를 들어,
아래 포스팅에서 만들 모델을 가져왔습니다.
Isolation Forest와 One-Class SVM
우리의 현실 데이터는 Imbalanced 된 data가 많이 존재하죠. 그래서 오늘은 Imbalanced 된 데이터를 분석하는 모델링에 대해서 알아보려고 합니다. 1. Isolation Forest 2. One Class SVM 위의 두개에 대해서 알아.
favoritethings.tistory.com
아래와 같이
predict한 값을 return받았다고 해보죠.
|
1
2
|
p_ocsvm=oc_model(ocsvm, train_scaled_x, test_scaled_x, test_y)
p_isf=oc_model(isf, train_scaled_x, test_scaled_x, test_y)
|
cs |
그렇다면 그 predict값이 실제 분류를 잘 맞춘 지 확인하기 위해서
위의 roc_curve_fnc 함수에 predict값을 넣어주기만 하면 됩니다.
>> roc_curve_fnc(p_ocsvm)
2. 여러개의 커브를 같은 화면에 그리기
|
1
2
3
4
5
6
7
8
9
10
11
12
13
14
15
16
17
|
# F_positive_rate, T_positive_rate 구하기
ocsvmF_positive_rate, ocsvmT_positive_rate, ocsvm_thresholds =roc_curve(pred_ocsvm, y_test)
isfF_positive_rate, isfT_positive_rate, isv_thresholds =roc_curve(pred_isf, y_test)
xgF_positive_rate, xgT_positive_rate, xg_thresholds =roc_curve(pred_xg, y_test)
#roc_auc
ocsvm_roc_auc = auc(ocsvmF_positive_rate, ocsvmT_positive_rate)
isf_roc_auc = auc(isfF_positive_rate, isfT_positive_rate)
xg_roc_auc = auc(xgF_positive_rate, xgT_positive_rate)
plt.step(ocsvmF_positive_rate, ocsvmT_positive_rate, color='blue', lw=2)
plt.step(isfF_positive_rate, isfT_positive_rate, color='red', lw=2)
plt.step(xgF_positive_rate, xgT_positive_rate, color='green', lw=2)
plt.legend(['ocsvm','isf','xg'])
plt.show()
|
cs |

여러개의 ROC커브를 한 화면에 그리면 더 비교가 쉽다는 장점이 있습니다.
'IT > 파이썬' 카테고리의 다른 글
| 선형보간법(interpolation)으로 결측치 채우기 (0) | 2021.04.21 |
|---|---|
| 데이터 추출하기 - 정규분포 vs. 임의복원추출 (0) | 2021.04.19 |
| Precision 과 Recall, 그리고 Accuracy (0) | 2021.04.15 |
| Isolation Forest와 One-Class SVM (0) | 2021.02.23 |
| [그래프] 3D 그래프 그리기 (0) | 2021.02.19 |