Group Properties:
I. Balanced: Spectral clustering
II. Robust: k-connected graphs
III. Modular: Modularity Maximization
IV. Dense: Quasi-cliques
V. Hierarchical: Hierarchical clustering
2. Robust communities:
k-vertext connected: k개의 node를 제외해도 분리되지 않는 subgraph를 의미함
(k-connected 그래프라고도 함)
k-edge connected: k개의 edge를 제외해도 분리되지 않는 subgraph를 의미함
** cycle인 그래프에서는 2-connected graph임

3. Modular communities:
v개의 노드와 m개(|E|=m)의 edge가 있을 때, vi와 vj사이가 연결될 가능성을 고려하는 것
* vi의 edge는 di, vj의 edge는 dj임
위의 기대치는 vi에서 나가는 모든 edge(di)중에서 dj의 개수임
이런 random한 기대치는 real-world network와는 차이가 있음
그러므로, 새로 구성한 SNS network가 이런 random한 기대치와 차이가 크면
real-world 와 유사하다고 할 수 있음.
그러므로 modularity는 real-world와의 차이를 설명하는 지표로 사용할 수 있음
(modularity의 최대값은 거리가 크다고 할 수 있는 것임)
Modularity maximization
- partition을 구하는 방법 중에 하나임(spectral clustering과 유사함)
didj/2m: di와 dj가 연결되어있을 기대치임
특정 partition(P군집)이 real-world와 얼마나 차이가 있는지에 대해서 알아 보는 것임
Q값을 가장 크게 하는 partition 을 찾는 것인데
spectral clustering과 유사한 방법으로 구할 수 있음
A-dd(T)에서 d는 모든 노드의 degree vector임 [3, 2, 3, ...]
: 1노드의 edge는 3개, 2노드의 edge는 2개....
modularity matrix를 통해 구한 eigen vector에 대해
2개의 그룹으로 k-means를 구하면 {1,2,3,4}, {5,6,7,8,9}를 구할 수 있음
→ 각각의 partion에 해당하는 노드를 구할 수 있음
4. Dense communities: 그래프의 밀도 파악하기
그래프의 밀도는 clique와 얼마나 가까운가를 비교해서 파악할 수 있음
감마가 1에 가까우면 밀도가 높고, 0이면 sparse하다고 할 수 있음
gamma-dense의 그래프라고 하면 아래 수식을 만족하는 그래프임
1-dense 그래프는 clique임
gamma-dense 그래프를 찾는 process
1단계. Local search
maximal한 gamma-dense그래프를 찾아 확장시키다가
density가 gamma이하로 떨어지면 중단함
2단계. Heuristic pruning
그 다음 recursive하게 gamma * k(clique의 원하는 사이즈)보다 작은 degree를 갖는 노드와 그와 연결된 edge를 제거함
5. Hierarchical communities
- merged 방식으로 찾는 방식 (agglomerative hierarchical clustering)
처음의 각각의 노드를 하나의 community으로 생각하고 점점 합쳐나가는 방식
- split으로 찾는 방식 (divisive hierarchical clustering)
전체를 하나의 큰 community로 생각하고 점점 쪼개나가는 방식
→ Girvan-Newman Algorithm을 사용함
Girvan-Newman Algorithm
: recursively remove the “weakest” links within a “community”
Girvan-Newman Algorithm process
– Find the edge with the weakest link
– Remove the edge and update the corresponding strength of each edge
위의 2 단계를 반복적으로 작업하여 원하는 component가 될때까지 작업함
edge betweenness
어떤 edge가 가장 weak한지 찾기 위해서는
→ edge betweenness 알고리즘을 사용함
edge betweenness 가 가장 큰 값이 bridge node에 해당하므로
그 노드를 먼저 제거함
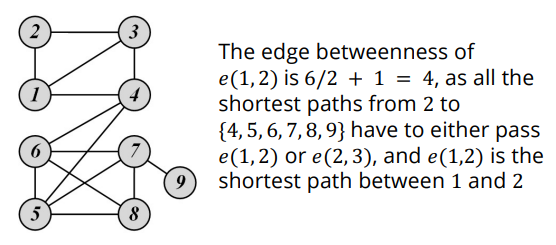
2에서 출발해서 1을 거쳐서 {4,5,6,7,8,9}로 가는 방법은
6가지인데, 원래는 3을거쳐서 가는 방법도 있으니
2로 나눠주고 2로 시작해서 1로 끝나는 것은 한가지 경우이므로 1을 더해줌
1. 이런 방법으로 edge betweenness값을 모든 edge에 대해 계산
2. 그 중 가장 큰 값을 갖는 edge를 제거
3. 다시 edge betweennesss 값을 계산함
4. 모든 edge가 다 제거될 때 까지 반복함
'IT > SNS분석' 카테고리의 다른 글
| Information diffusion(확산) (0) | 2022.06.14 |
|---|---|
| community evolution & evaluation (0) | 2022.06.07 |
| community analysis 2 (0) | 2022.05.24 |
| community analysis 1 (0) | 2022.05.17 |
| Classification with Network Information (0) | 2022.05.10 |